Influxdb has no useful functions to look at the real database size.
As I have created a retention policy combined with continuous queries I want to see the exact values per database.
I use the following approach:
- in Crontab a bash is executed to get the real influxes database values
- the values are then pushed into a dedicated database for storing the values
- Grafana dashboard setup to show the values
Crontab
vi /etc/crontab and add the following line:
*/30 * * * * root sh /home/pi/test.sh >/dev/null 2>&1the script /home/pi/test.sh is executed every half an hour
Bash-script
vi /home/pi/test.sh and paste this code in:
#!/usr/bin/env bash

#get real database size
telegraf_data=$(du -s /var/lib/influxdb/data/telegraf | awk '{print $1}')
_internal_data=$(du -s /var/lib/influxdb/data/_internal | awk '{print $1}')
openhab_db_data=$(du -s /var/lib/influxdb/data/openhab_db | awk '{print $1}')
collectd_data=$(du -s /var/lib/influxdb/data/collectd | awk '{print $1}')
mydbsize_data=$(du -s /var/lib/influxdb/data/mydbsize | awk '{print $1}')

#print real database size to screen
echo "******"
echo $telegraf_data
echo $_internal_data
echo $openhab_db_data
echo $collectd_data
echo $mydbsize_data
echo "******"

#push real database size values to database mydbsize
curl -i -XPOST 'http://localhost:8086/write?db=mydbsize' --data-binary 'database,dbsize=telegraf Size='"$telegraf_data"' '
curl -i -XPOST 'http://localhost:8086/write?db=mydbsize' --data-binary 'database,dbsize=_internal Size='"$_internal_data"' '
curl -i -XPOST 'http://localhost:8086/write?db=mydbsize' --data-binary 'database,dbsize=openhab_db Size='"$openhab_db_data"' '
curl -i -XPOST 'http://localhost:8086/write?db=mydbsize' --data-binary 'database,dbsize=collectd Size='"$collectd_data"' '
curl -i -XPOST 'http://localhost:8086/write?db=mydbsize' --data-binary 'database,dbsize=mydbsize Size='"$mydbsize_data"' '

#End
I have created a dedicated database for these measurements in my case:
root@raspi5:/home/pi# influx
Connected to http://localhost:8086 version 1.8.10
InfluxDB shell version: 1.8.10
> create database mydbsize
Grafana-dashboard
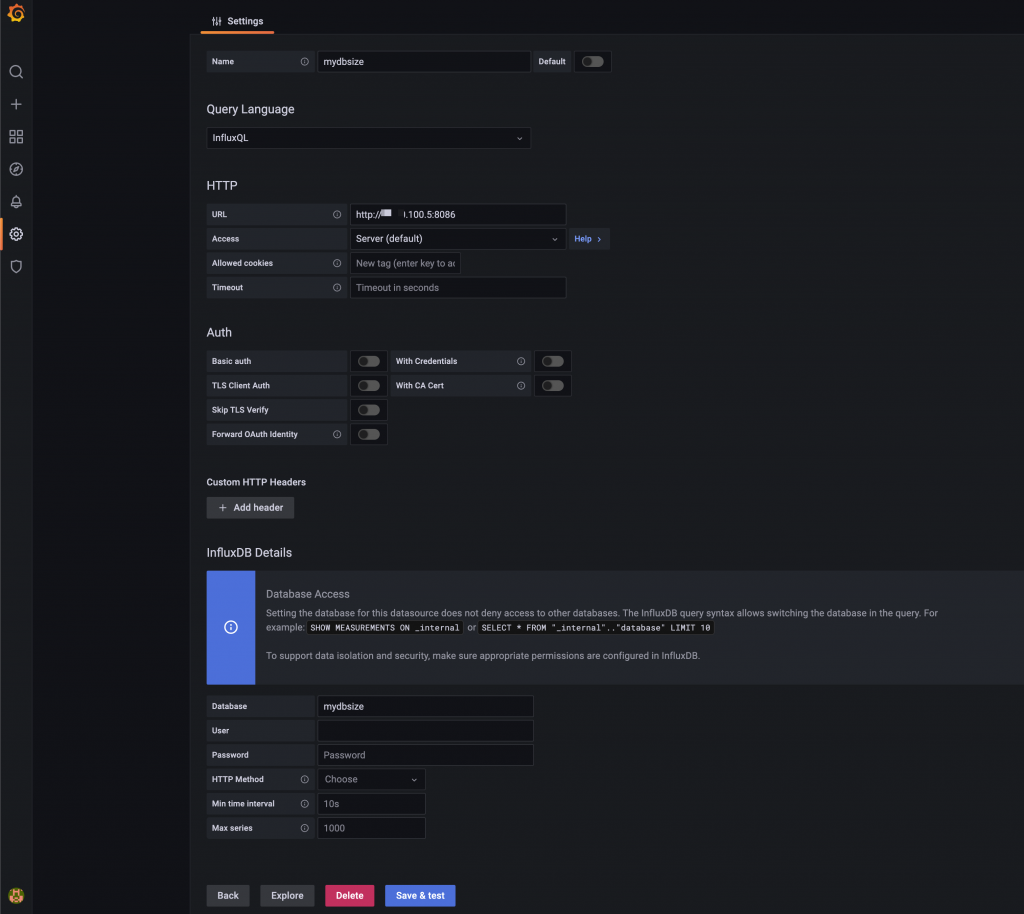
Create a new db-source in Grafana:
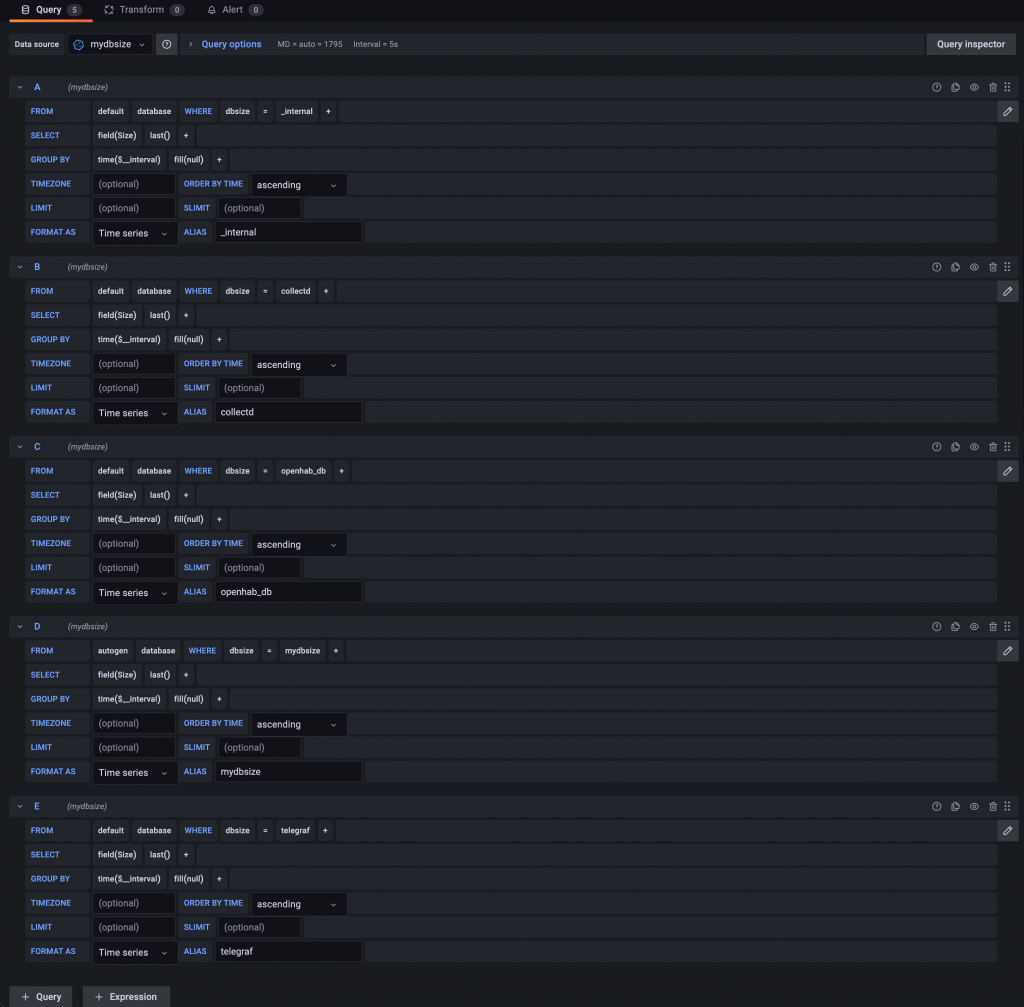
Add the queries per database in Grafana
Panel shown as JSON-data
{
  "id": 8,
  "gridPos": {
    "h": 14,
    "w": 23,
    "x": 0,
    "y": 9
  },
  "type": "timeseries",
  "title": "DB size",
  "datasource": {
    "type": "influxdb",
    "uid": "cq2DkaZgk"
  },
  "pluginVersion": "8.4.4",
  "links": [],
  "fieldConfig": {
    "defaults": {
      "custom": {
        "drawStyle": "line",
        "lineInterpolation": "smooth",
        "barAlignment": 0,
        "lineWidth": 2,
        "fillOpacity": 10,
        "gradientMode": "none",
        "spanNulls": true,
        "showPoints": "auto",
        "pointSize": 4,
        "stacking": {
          "mode": "none",
          "group": "A"
        },
        "axisPlacement": "auto",
        "axisLabel": "",
        "scaleDistribution": {
          "type": "log",
          "log": 2
        },
        "hideFrom": {
          "tooltip": false,
          "viz": false,
          "legend": false
        },
        "thresholdsStyle": {
          "mode": "off"
        },
        "lineStyle": {
          "fill": "solid"
        }
      },
      "color": {
        "mode": "palette-classic"
      },
      "mappings": [],
      "thresholds": {
        "mode": "absolute",
        "steps": [
          {
            "color": "green",
            "value": null
          },
          {
            "color": "red",
            "value": 80
          }
        ]
      },
      "unit": "deckbytes"
    },
    "overrides": []
  },
  "options": {
    "tooltip": {
      "mode": "multi",
      "sort": "none"
    },
    "legend": {
      "displayMode": "table",
      "placement": "bottom",
      "calcs": [
        "lastNotNull",
        "max",
        "min"
      ]
    }
  },
  "targets": [
    {
      "alias": "_internal",
      "datasource": {
        "type": "influxdb",
        "uid": "cq2DkaZgk"
      },
      "groupBy": [
        {
          "params": [
            "$__interval"
          ],
          "type": "time"
        },
        {
          "params": [
            "null"
          ],
          "type": "fill"
        }
      ],
      "hide": false,
      "measurement": "database",
      "orderByTime": "ASC",
      "policy": "default",
      "refId": "A",
      "resultFormat": "time_series",
      "select": [
        [
          {
            "params": [
              "Size"
            ],
            "type": "field"
          },
          {
            "params": [],
            "type": "last"
          }
        ]
      ],
      "tags": [
        {
          "key": "dbsize",
          "operator": "=",
          "value": "_internal"
        }
      ]
    },
    {
      "alias": "collectd",
      "datasource": {
        "type": "influxdb",
        "uid": "cq2DkaZgk"
      },
      "groupBy": [
        {
          "params": [
            "$__interval"
          ],
          "type": "time"
        },
        {
          "params": [
            "null"
          ],
          "type": "fill"
        }
      ],
      "hide": false,
      "measurement": "database",
      "orderByTime": "ASC",
      "policy": "default",
      "refId": "B",
      "resultFormat": "time_series",
      "select": [
        [
          {
            "params": [
              "Size"
            ],
            "type": "field"
          },
          {
            "params": [],
            "type": "last"
          }
        ]
      ],
      "tags": [
        {
          "key": "dbsize",
          "operator": "=",
          "value": "collectd"
        }
      ]
    },
    {
      "alias": "openhab_db",
      "datasource": {
        "type": "influxdb",
        "uid": "cq2DkaZgk"
      },
      "groupBy": [
        {
          "params": [
            "$__interval"
          ],
          "type": "time"
        },
        {
          "params": [
            "null"
          ],
          "type": "fill"
        }
      ],
      "hide": false,
      "measurement": "database",
      "orderByTime": "ASC",
      "policy": "default",
      "refId": "C",
      "resultFormat": "time_series",
      "select": [
        [
          {
            "params": [
              "Size"
            ],
            "type": "field"
          },
          {
            "params": [],
            "type": "last"
          }
        ]
      ],
      "tags": [
        {
          "key": "dbsize",
          "operator": "=",
          "value": "openhab_db"
        }
      ]
    },
    {
      "alias": "mydbsize",
      "datasource": {
        "type": "influxdb",
        "uid": "cq2DkaZgk"
      },
      "groupBy": [
        {
          "params": [
            "$__interval"
          ],
          "type": "time"
        },
        {
          "params": [
            "null"
          ],
          "type": "fill"
        }
      ],
      "hide": false,
      "measurement": "database",
      "orderByTime": "ASC",
      "policy": "autogen",
      "refId": "D",
      "resultFormat": "time_series",
      "select": [
        [
          {
            "params": [
              "Size"
            ],
            "type": "field"
          },
          {
            "params": [],
            "type": "last"
          }
        ]
      ],
      "tags": [
        {
          "key": "dbsize",
          "operator": "=",
          "value": "mydbsize"
        }
      ]
    },
    {
      "alias": "telegraf",
      "datasource": {
        "type": "influxdb",
        "uid": "cq2DkaZgk"
      },
      "groupBy": [
        {
          "params": [
            "$__interval"
          ],
          "type": "time"
        },
        {
          "params": [
            "null"
          ],
          "type": "fill"
        }
      ],
      "hide": false,
      "measurement": "database",
      "orderByTime": "ASC",
      "policy": "default",
      "refId": "E",
      "resultFormat": "time_series",
      "select": [
        [
          {
            "params": [
              "Size"
            ],
            "type": "field"
          },
          {
            "params": [],
            "type": "last"
          }
        ]
      ],
      "tags": [
        {
          "key": "dbsize",
          "operator": "=",
          "value": "telegraf"
        }
      ]
    }
  ]
}
Example-view of dashboard:
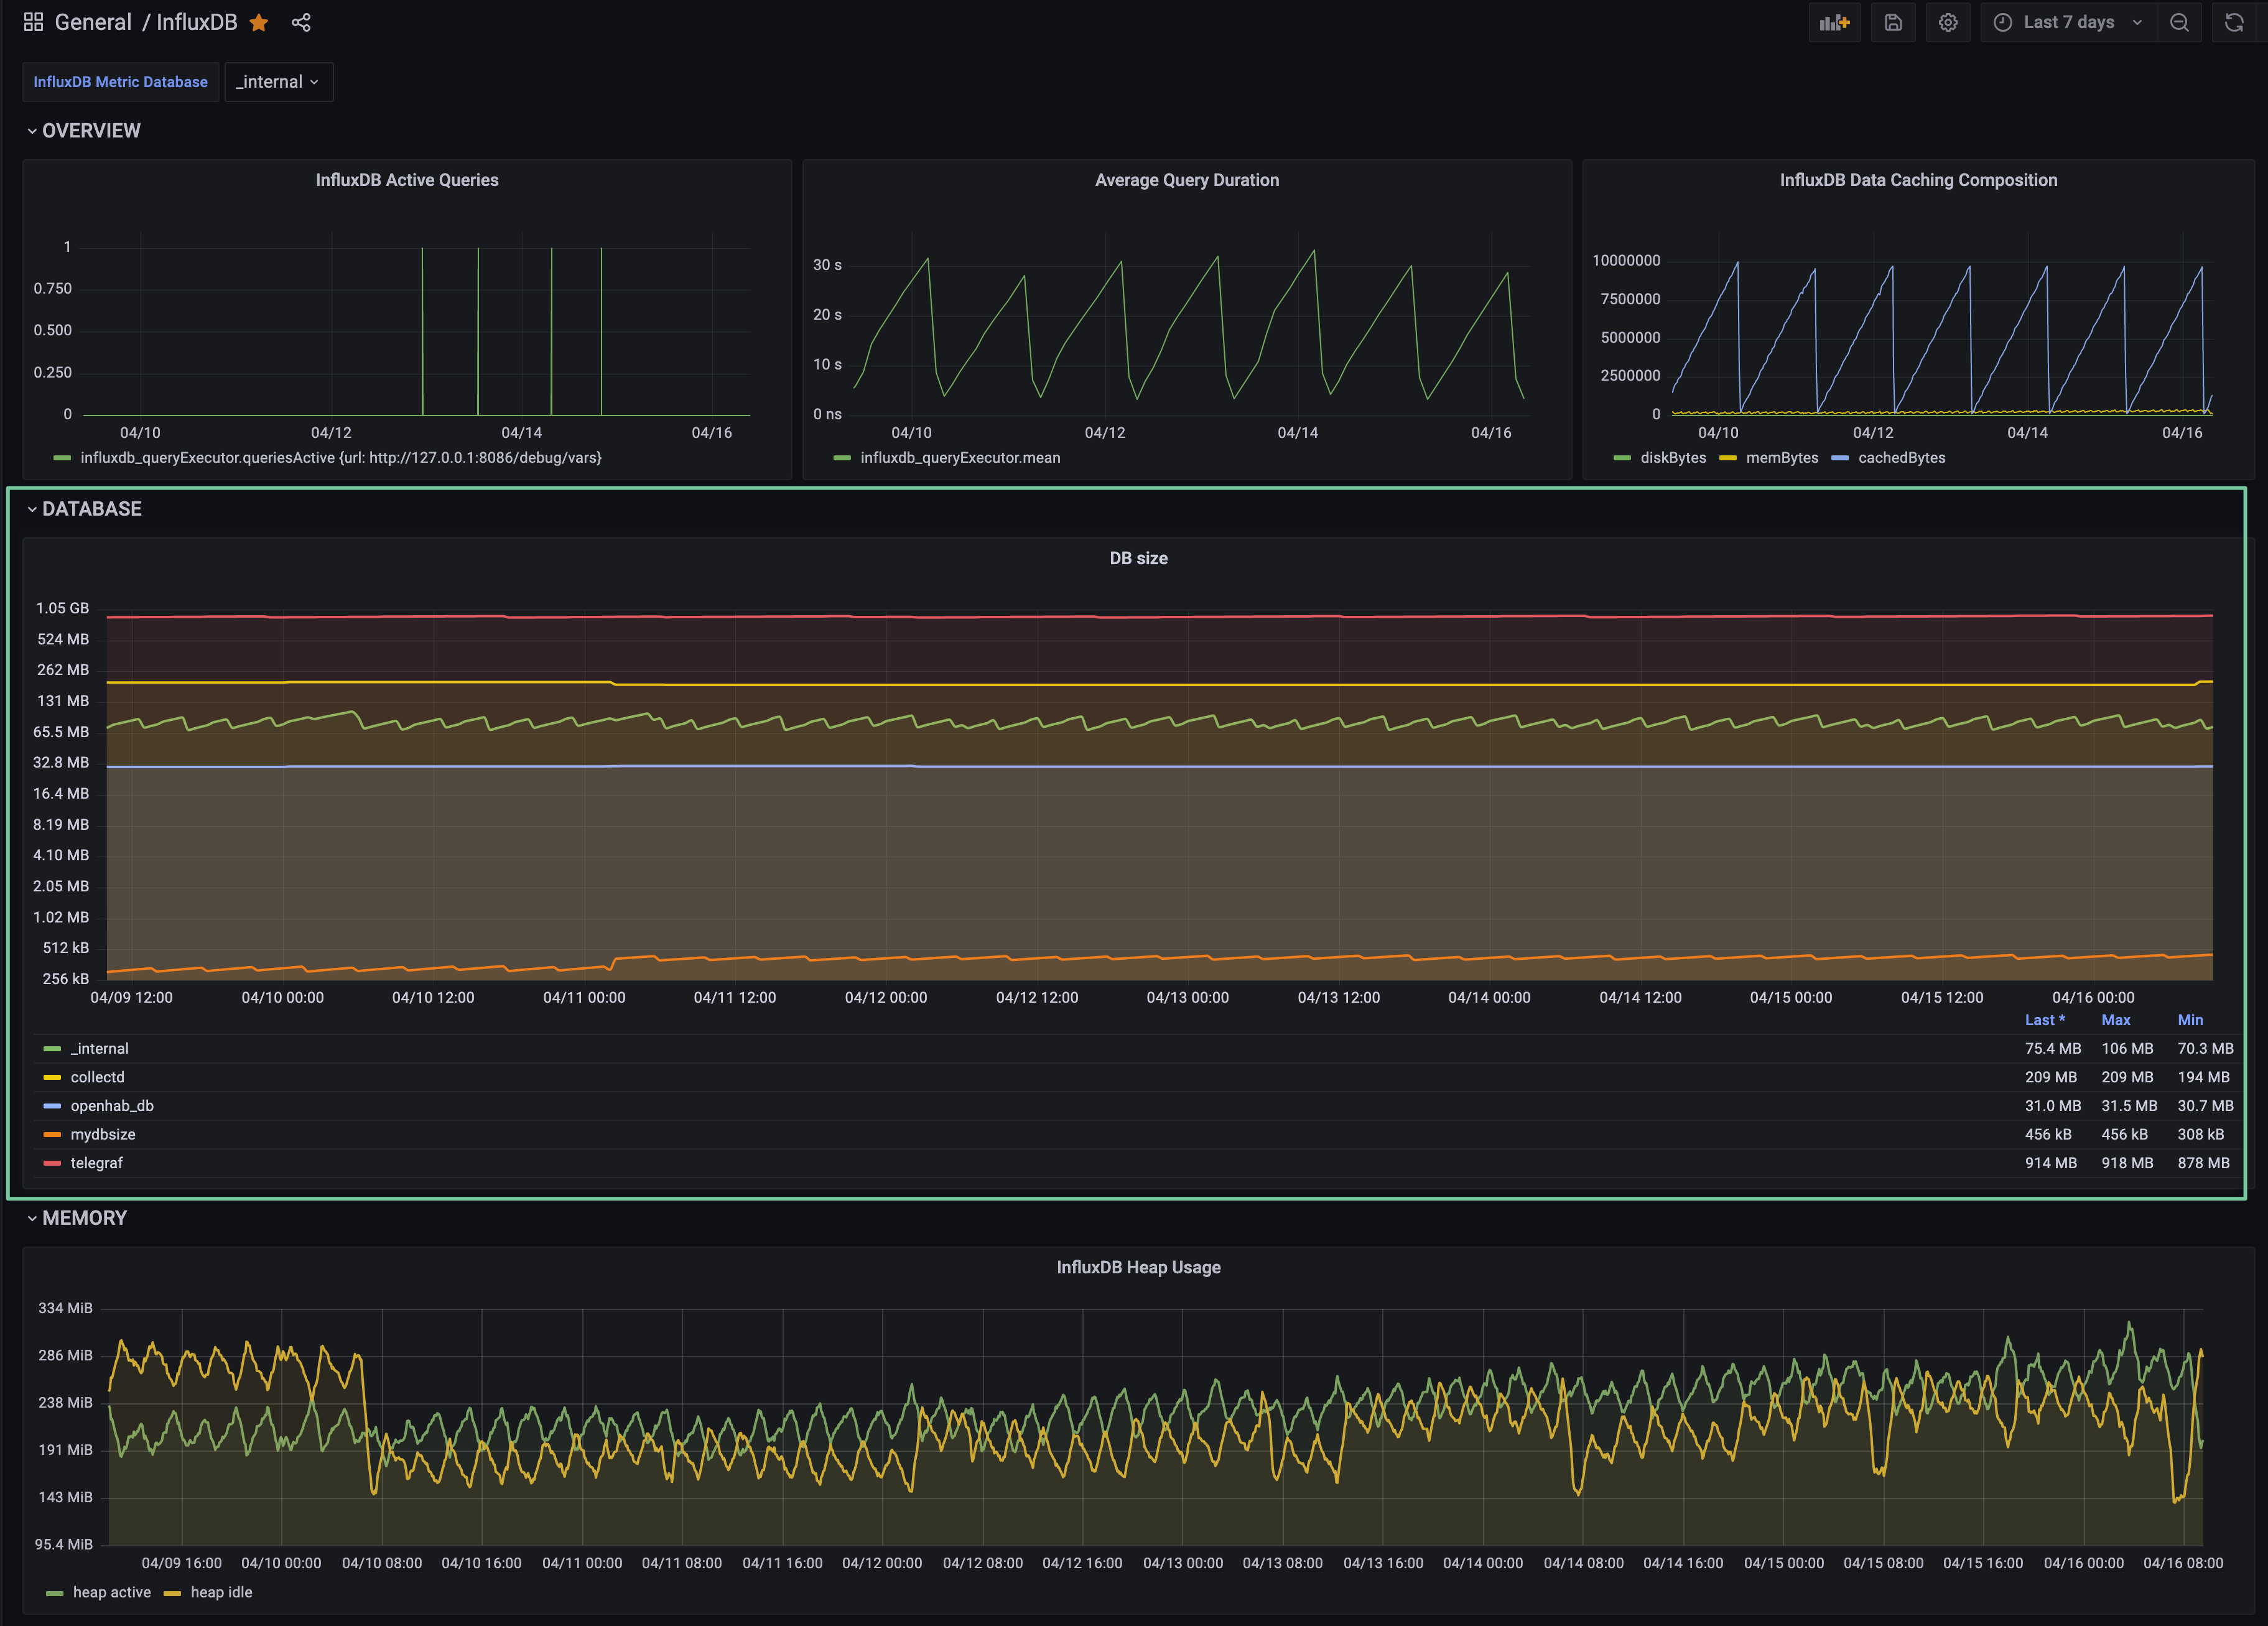
done!